What “drone mapping” actually means in 2026
Three deliverables dominate KSA drone mapping work, each with its own cost curve:
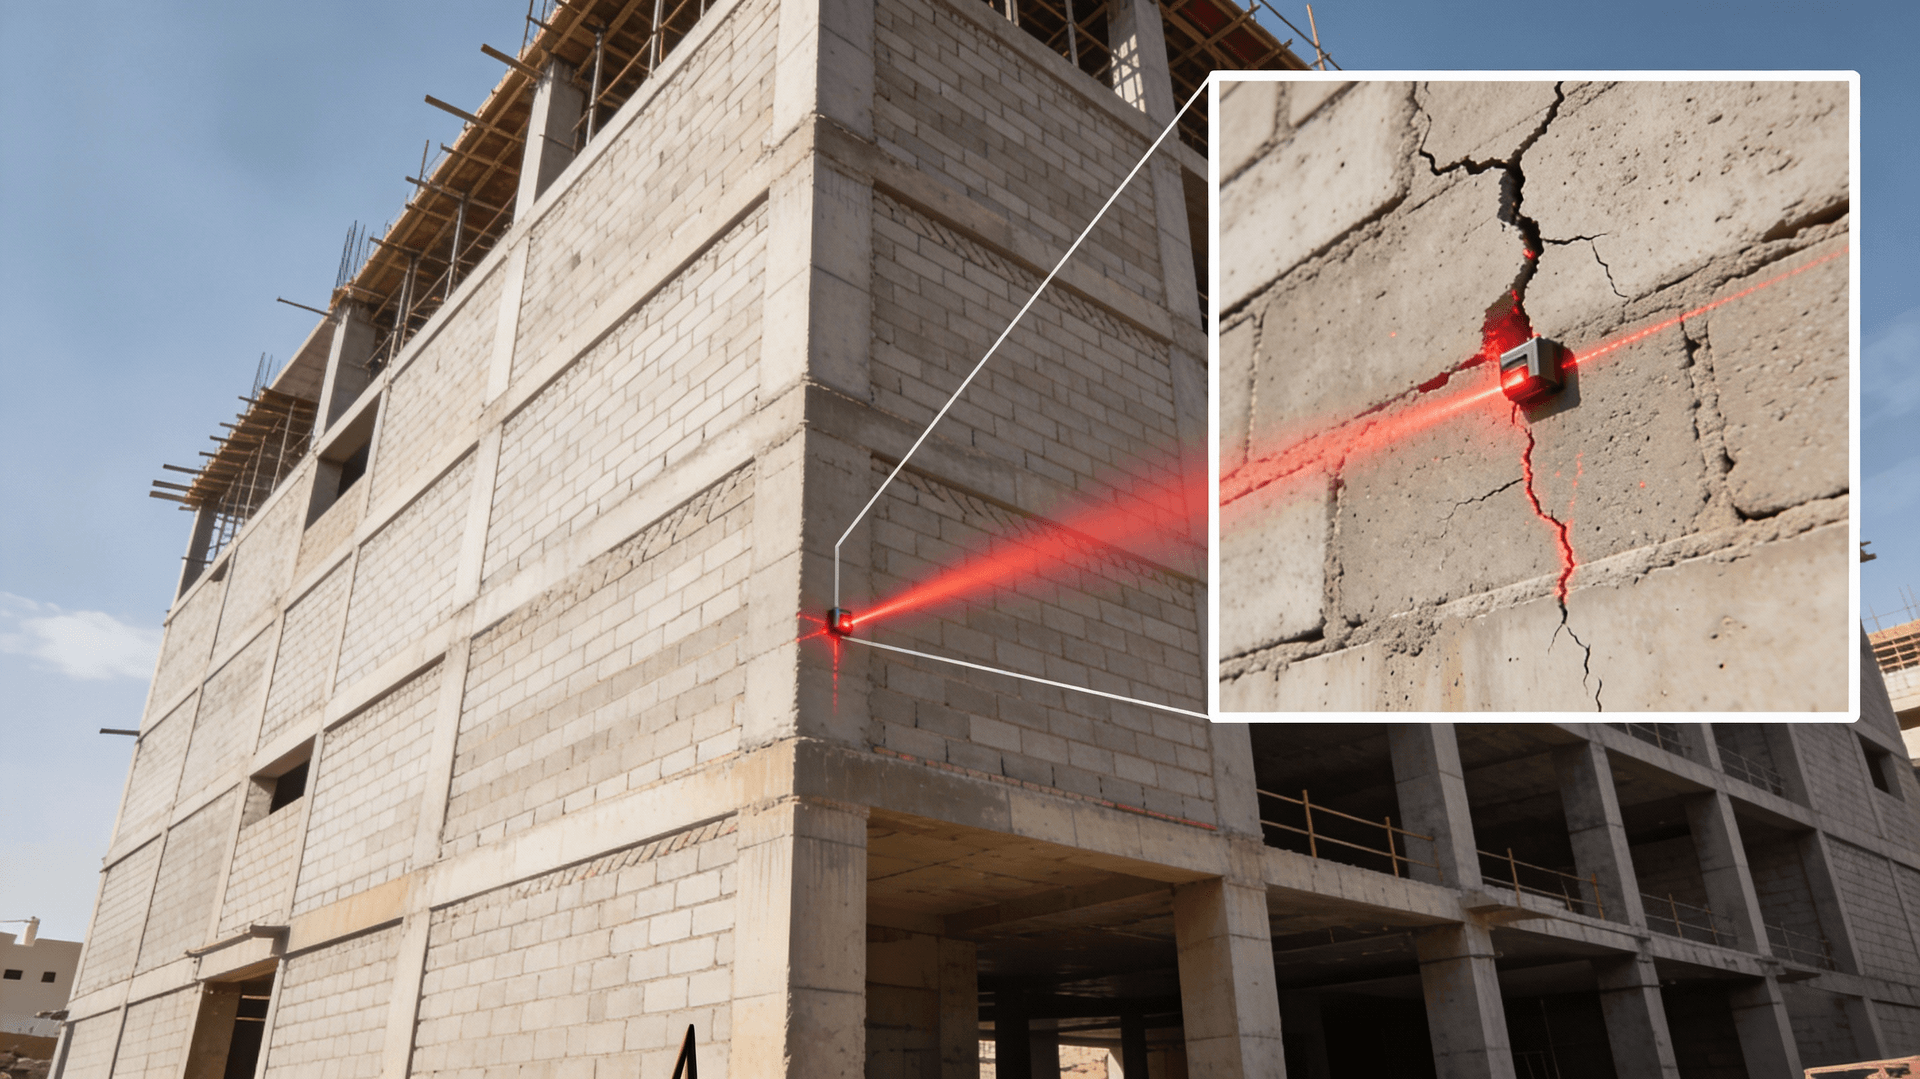
- RTK photogrammetry orthomosaic + DEM — the base case for most construction and quarry sites. See the drone site survey solution and the photogrammetry glossary entry.
- LiDAR point cloud + DEM — required for vegetated areas, dense brownfield sites, or where vertical accuracy below 5 cm is a contractual requirement. See the LiDAR glossary and the photogrammetry vs LiDAR comparison.
- Thermal sweep — pipelines, solar farms, electrical substations. See thermal inspection and the oil & gas drone inspection guide.
Each pricing range below assumes a fully delivered output (georeferenced, GCP-anchored, QA-passed), not raw imagery.
Cost drivers that actually move pricing
Five drivers explain most variance:
| Driver | Effect | Typical magnitude |
|---|---|---|
| GACA permit class | Class 1 halves overhead per mission | 10–25% of total |
| Terrain | Slope, urban density, vegetation | 20–80% |
| Required vertical accuracy | Below 5 cm forces lidar or dense photogrammetry | 30–200% |
| GCP and RTK requirements | More GCPs means more ground time | 5–15% |
| Output deliverable | Orthomosaic only vs full DEM + classified point cloud | 0–60% |
For a deeper dive on one specific accuracy threshold see the LiDAR vs photogrammetry answer.
Photogrammetry — SAR per hectare, 2026
Indicative ranges for RTK photogrammetry with 3 cm GSD orthomosaic and a digital elevation model:
| Project size | Flat desert | Urban / mixed | Mountainous |
|---|---|---|---|
| < 50 ha | 220–350 | 320–520 | 500–800 |
| 50–500 ha | 110–180 | 180–320 | 280–500 |
| 500–5,000 ha | 70–110 | 110–180 | 180–300 |
| > 5,000 ha | 60–90 | 90–140 | 140–240 |
[VERIFY-SME — these reflect KSA market in late 2025 / early 2026 and assume a Class 1 GACA standing permit; spot permits add 8–15%].
LiDAR — SAR per hectare, 2026
LiDAR is more expensive but unavoidable in three cases: dense vegetation, sub-5 cm vertical, or where the deliverable is a classified ground-vs-canopy point cloud.
| Project size | Flat desert | Urban / mixed | Mountainous |
|---|---|---|---|
| < 50 ha | 600–950 | 800–1,300 | 1,000–1,800 |
| 50–500 ha | 320–500 | 450–750 | 600–1,100 |
| 500–5,000 ha | 200–350 | 280–500 | 380–700 |
| > 5,000 ha | 160–280 | 220–400 | 300–550 |
These ranges assume a Zenmuse L2 or L3 sensor on a Matrice-class platform [VERIFY-SME].
Thermal sweeps — pricing by length, not area
Thermal work is usually priced by linear kilometre or by panel count, not by hectare.
- Pipelines: SAR 280–650 per linear km depending on access and altitude restrictions.
- Solar farms: SAR 8–18 per kW DC for a single thermal sweep with anomaly classification.
- Substations: SAR 1,200–2,500 per substation, fixed price for a standard sweep.
For methodology see the thermal drone inspection for Aramco pipelines piece.
GACA permit overhead
Three permit modes drive different cost lines:
- Spot permit — single-mission, adds 8–15% to mission cost, 5–10 working days lead time.
- Standing Class 1 permit — covers a defined corridor or site, monthly renewal, halves marginal mission overhead.
- BVLOS permit — required for The Line corridor and pipeline runs above visual line-of-sight; adds 20–35% but unlocks 3–5× area per flight day.
For the permit chain end-to-end see the GACA drone permits guide and the BVLOS-specific piece. Glossary anchor: GACA.
Hidden costs that bite in KSA
Five line items routinely missed in first-draft budgets:
- GCP placement in remote terrain — SAR 2,000–6,000 per day for a survey crew.
- Sandstorm re-flights — bake a 10–15% contingency into any project flown June–September.
- Customs and shipping for new sensors — 3–6 weeks lead time for first deployment.
- PDPL and security clearances for sensitive sites (Aramco, MoD-adjacent) — 2–6 weeks.
- Data delivery storage — multi-terabyte point clouds need a KSA-resident handover path.
How to compare vendor quotes fairly
A clean comparison requires four columns:
| Column | What to ask for |
|---|---|
| GSD or point density | cm per pixel / points per m2 |
| Vertical accuracy | RMSE in cm at 95% confidence |
| Permit basis | Spot, Class 1, BVLOS |
| Deliverable list | Orthomosaic, DEM, point cloud, classified |
Without those four columns, a SAR-per-hectare number is meaningless. For a vendor-side view compare in the Pix4D vs FI Tech vs DroneDeploy piece.
Two worked examples
Example A — 800 ha quarry, flat desert, photogrammetry, Class 1 permit. Range: SAR 90–140 per ha. Total: SAR 72,000–112,000 per cycle.
Example B — 120 ha urban infill, lidar, vertical 4 cm, spot permit. Range: SAR 800–1,300 per ha. Total: SAR 96,000–156,000 per cycle.
Both ranges include data delivery to a KSA-resident analytics platform but exclude downstream BIM integration.
Next steps
If you are scoping a 2026 drone mapping budget, start with the drone site survey solution, the photogrammetry vs lidar guide, and the 3D drone progress comparison piece. Cross-check with the best drone survey company in Saudi Arabia answer.
Book a mapping scoping call and we will produce a SAR-per-hectare envelope for your specific terrain and accuracy class within five working days.